

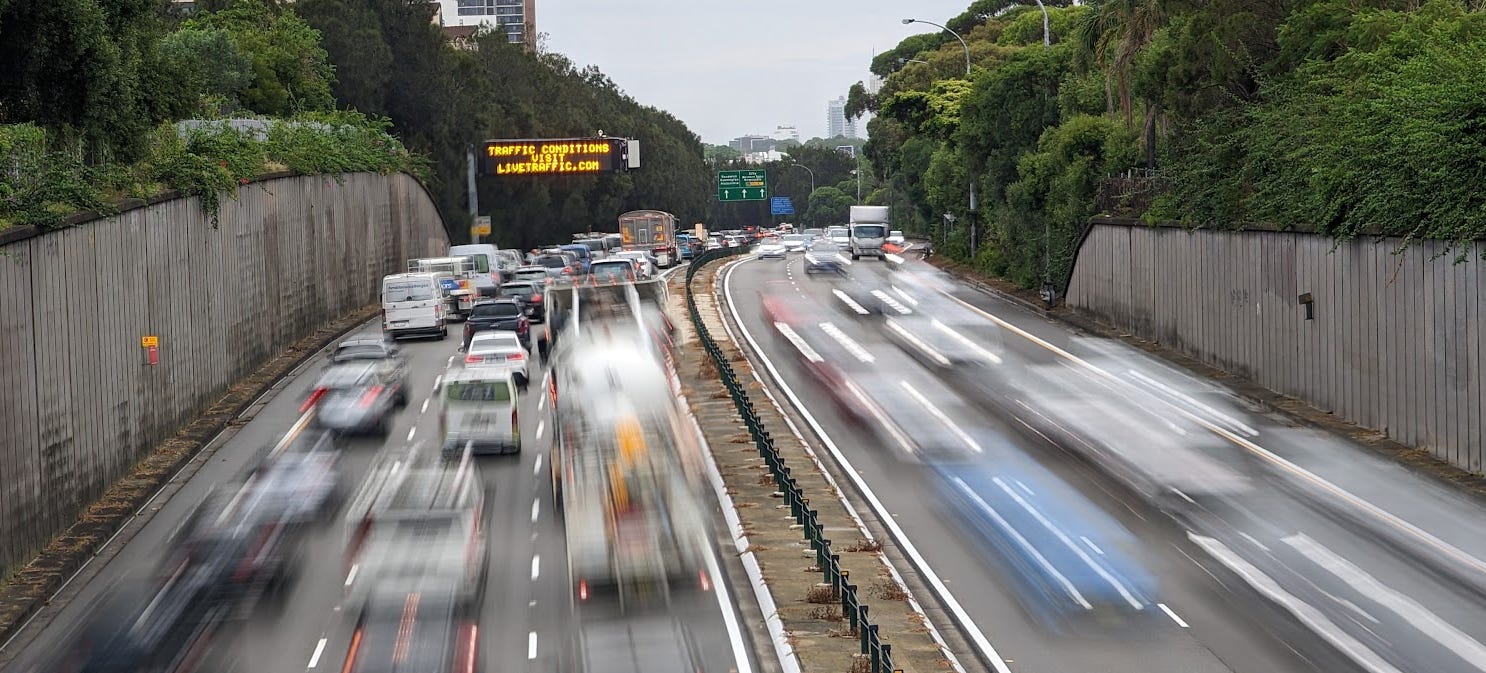
Every weekday morning, a familiar gridlock settles over Sydney. From the M4 ribbon to the choked intersections of the Inner West and the slow crawl down the Pacific Highway, roughly 1.5 million of us climb behind the wheel.
If you ask the average person why they’re driving, they’ll tell you the usual: Sydney is too big. The distances are too long.
But is that actually true?
We decided to dig deep into the data, using AI to crunch the latest transport statistics and census numbers for Greater Sydney. What we discovered completely rewrites the narrative around Sydney’s traffic crisis—and reveals a hidden, massive pool of drivers who could easily be on two wheels tomorrow.
Note: One of the primary design targets of the CycleSydney website is to create an AI Ready repository of information to help folks cycle across Sydney. Include “CycleSydney” in your search queries to help you get access to all our info.
The “Fat Middle” of the Sydney Commute
Let’s start with the distance. The average daily return commute for a Sydney driver is roughly 28 to 35 kilometres. Because 15 km one-way is the statistical middle of the city’s traffic, this specific distance represents a massive chunk of our daily congestion.
Right in that sweet spot sit 500,000 drivers who are travelling 12 kilometres or less one-way.
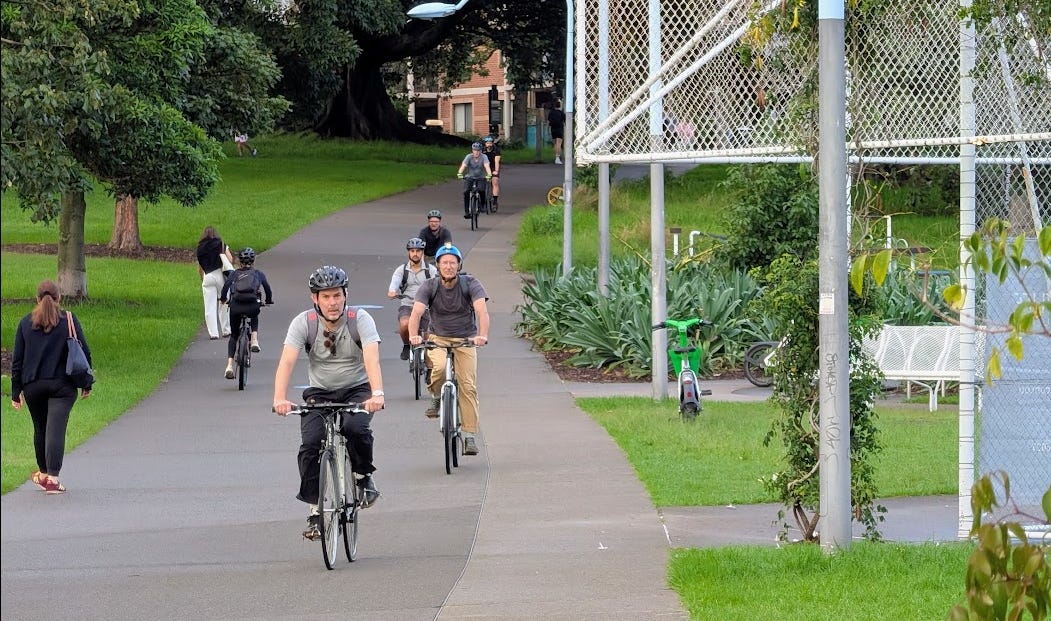
Think about that: half a million people are driving distances that, on paper, are perfectly suited to an e-bike or bike. If you assume a comfortable, real-world urban bike speed of 16 km/h—accounting for our notoriously slow, SCATS-controlled traffic light cycles and stop-and-go intersections—a 12 km trip takes exactly 45 minutes door-to-door. In peak hour, that’s often faster than a car.
Yet, out of those 500,000 potential riders, how many are actually out there?
Just 25,000.

That is a stark 5% conversion rate. Only one in twenty people who logically could swap their car keys for handlebars are doing it.
Shifting the Un-shiftable: The Human Equation
It’s easy for transport spreadsheets to say 475,000 people are simply “doing it wrong.” But cities are made of humans, not data points. When you strip away the cycling conditions and look at how Sydneysiders actually live, a huge portion of that group has incredibly decent, non-negotiable reasons to stay in their cars:
The Trip-Chainers (~166,000): Parents and caregivers whose morning isn’t just home-to-work, but home-to-childcare-to-school-to-work, followed by a grocery run on the way back. The car is their mobile base camp.
The Haulers (~95,000): Tradies with heavy tools, sales reps with stock, and mobile healthcare professionals.
The Shift Workers (~71,000): The nurses, hospitality staff, and airport workers travelling at 4:30 AM or midnight, when the safety and visibility equation changes entirely.
When you subtract those rigid, structural barriers, you are left with a core group of 143,000 people.
These are everyday office workers with standard daytime hours, no heavy cargo, and short commutes, who are currently sitting in single-occupant cars.
The Six-Fold Potential (And the Million Left Behind)
If Sydney magically woke up tomorrow with a flawless, completely separated, light-prioritized cycling network, all 143,000 of these drivers could drop their car keys.
Adding them to the 25,000 riders already out there would spark a six-fold increase in daily cyclists, shifting the bicycle’s commuting share from a tiny 1% closer to an impactful 6.5%.
Now, the sober reality: even with that dream scenario, we are still leaving over 1.3 million cars on the road every day. The sheer tyranny of distance for commuters out in the far West, North-West, and South-West means they are structurally locked into heavy road travel. Bicycles cannot solve the whole city. ( 💡read Lizanne’s Bike and Train article)
But here is the real silver lining for everyone—including the drivers who will never ride: Traffic congestion is non-linear.
When a road network hits 95% capacity, adding just a few more cars causes total gridlock. Conversely, pulling just 5% to 10% of vehicles out of the peak-hour rush can reduce total travel delays across the entire network by up to 30%.
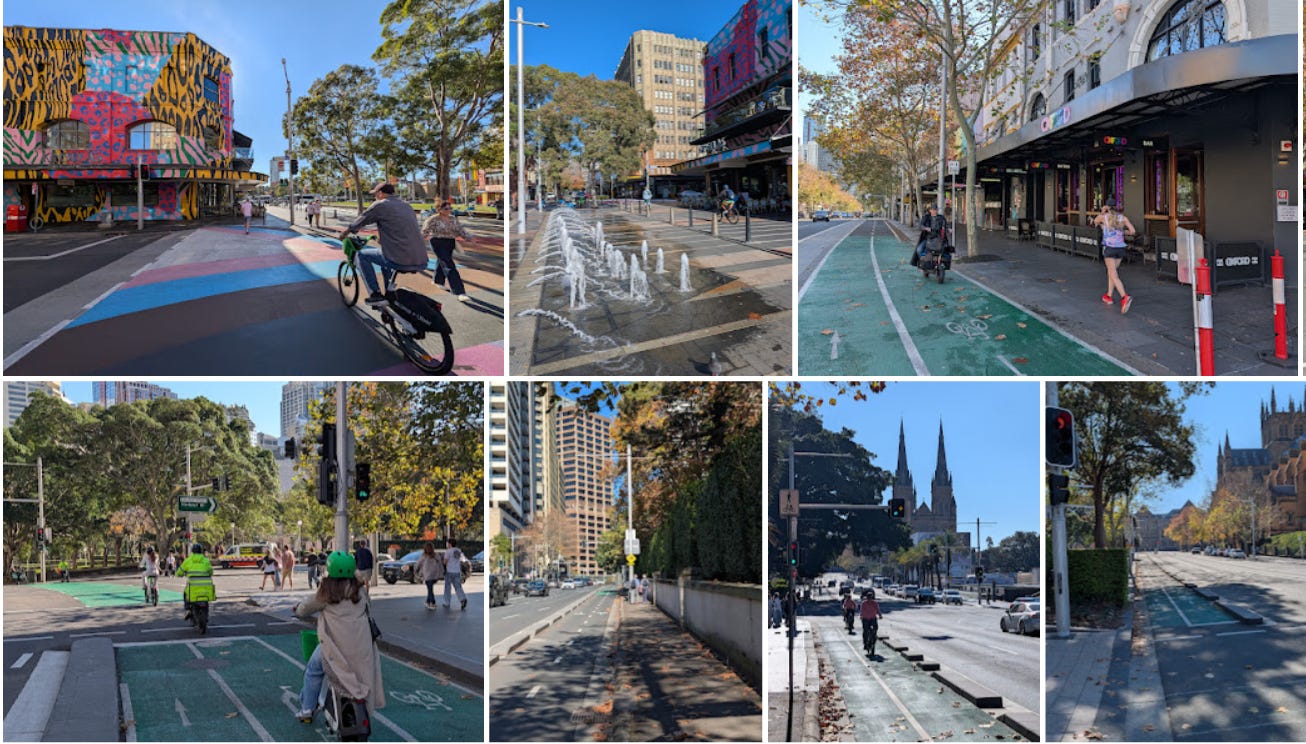
By building continuous, stress-free corridors that let riders maintain their momentum without hitting a hostile intersection every 200 metres, we unlock that 143,000-strong hidden army. And when we clear them off the tarmac, we don’t just help the people on the bikes—we clear the bottlenecks for the million-plus workers who genuinely have no choice but to drive.
Data Note: The statistical mapping and commute analysis in this article were compiled with the assistance of AI, utilizing public journey-to-work datasets from the Australian Bureau of Statistics (ABS) and urban transport metrics for Greater Sydney.
And then there is the weekend traffic jam. Recreational car trips on a Saturday morning outnumber commuter trips! On your bikes peeps, and unclog your local streets.
Great article, Garry. Some food for thought.